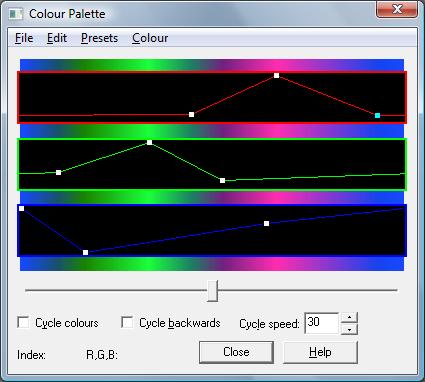
Colour Palette window
The Colour Palette window is where you adjust the colours used by a fractal to identify different iteration values. All open fractal windows use the same colour palette.
A good palette is absolutely critical to bringing out the detail and beauty of an interesting fractal image. Yet, most fractal exploration programs give you a very rudimentary and difficult-to-use palette editor. Typically, you use a grid of cells for the number of available colours, with sliders that let you adjust the red, green, and blue values of individual colours. If you are lucky, these programs supply a command to create a smooth transition between two colour cells.
We think we've found a better way in Fractal eXtreme. Instead of forcing you to adjust hundreds of separate colours, why not treat the red, green, and blue values as continuously varying quantities, controlled by a small number of control points, and visualized as a rainbow of colour, and three separate curves.
The three graphs, with curves flowing through them, control how the amount of red, green and blue should vary throughout the palette. Because iteration bands are, by default, colour mapped directly onto colours (with the colours repeating as needed), this also defines how the colours should change as the iterations change.
To open the Colour Palette window: On the Options menu, click Colour Palette.

The three most important operations in this window are:
- Move a control point -- Drag a control point around the graph. Moving a control point upwards increases the amount of that colour component, whereas moving it down lowers it. The control points can also be moved sideways, but cannot cross other control points.
- Add a control point -- Hold down the CTRL key as you click on one of the graphs.
- Delete a control point -- Select a control point, and then press the DELETE key.
Going from top to bottom the controls are:
- The top of the palette, with separate red, green, and blue graphs, is where you edit the red, green, and blue curves for the palette. The current palette is displayed behind the curves, updated as you change it.
- The slider is used to move the colour graphs horizontally. The left-most colour is used for the first iteration band in the fractal.
- The Cycle colours check box enables colour cycling, which is an automatic scrolling of the palette which can generate hypnotic swirling animations as the colours flow from the outer parts of the fractal to its interior. Note: Clicking outside the Colour Palette window or closing the window stops the colour cycling.
- The Cycle backwards and Cycle speed controls specify the direction and speed of the colour cycling. The speed is in colour positions per second, so at the default speed of 30 Fractal eXtreme will cycle through all of the colours in a bit less than eight seconds.
- The Index area displays the offset of the last selected control point within the colour palette. The index value can be any number between 10 and 237.
- The R, G, B area displays he red, green, and blue values of the last selected control point. Each value can be between 0 and 255.
Notes
- The palette that Fractal eXtreme uses for displaying fractals contains 228 colours. When antialiasing is enabled then the Interpolate Colours setting can be chosen in the colour mapping window which tells Fractal eXtreme to interpolate between adjacent colours, thus potentially giving thousands of different colours.
- The palette editor supports full multi-level undo and redo, loading and saving, and other options through its menus.

